

Self-Service
Build your own KPIs, charts, and dashboards.
No SQL required.
Build KPIs in the Query Builder, visualize them with Chart Genius, and assemble dashboards — all without writing a line of code.
No-code
Full close summary, not 2 days
SQL-ready
For power users
Drag & drop
Dashboards
100%
Governed data
Self-Service Reporting
Your own key figures and graphics - built easily, with additional dashboards on demand.
Business users define KPIs, build charts, and assemble dashboards themselves — no code, no IT ticket, no waiting.
KPIs (Query builder)
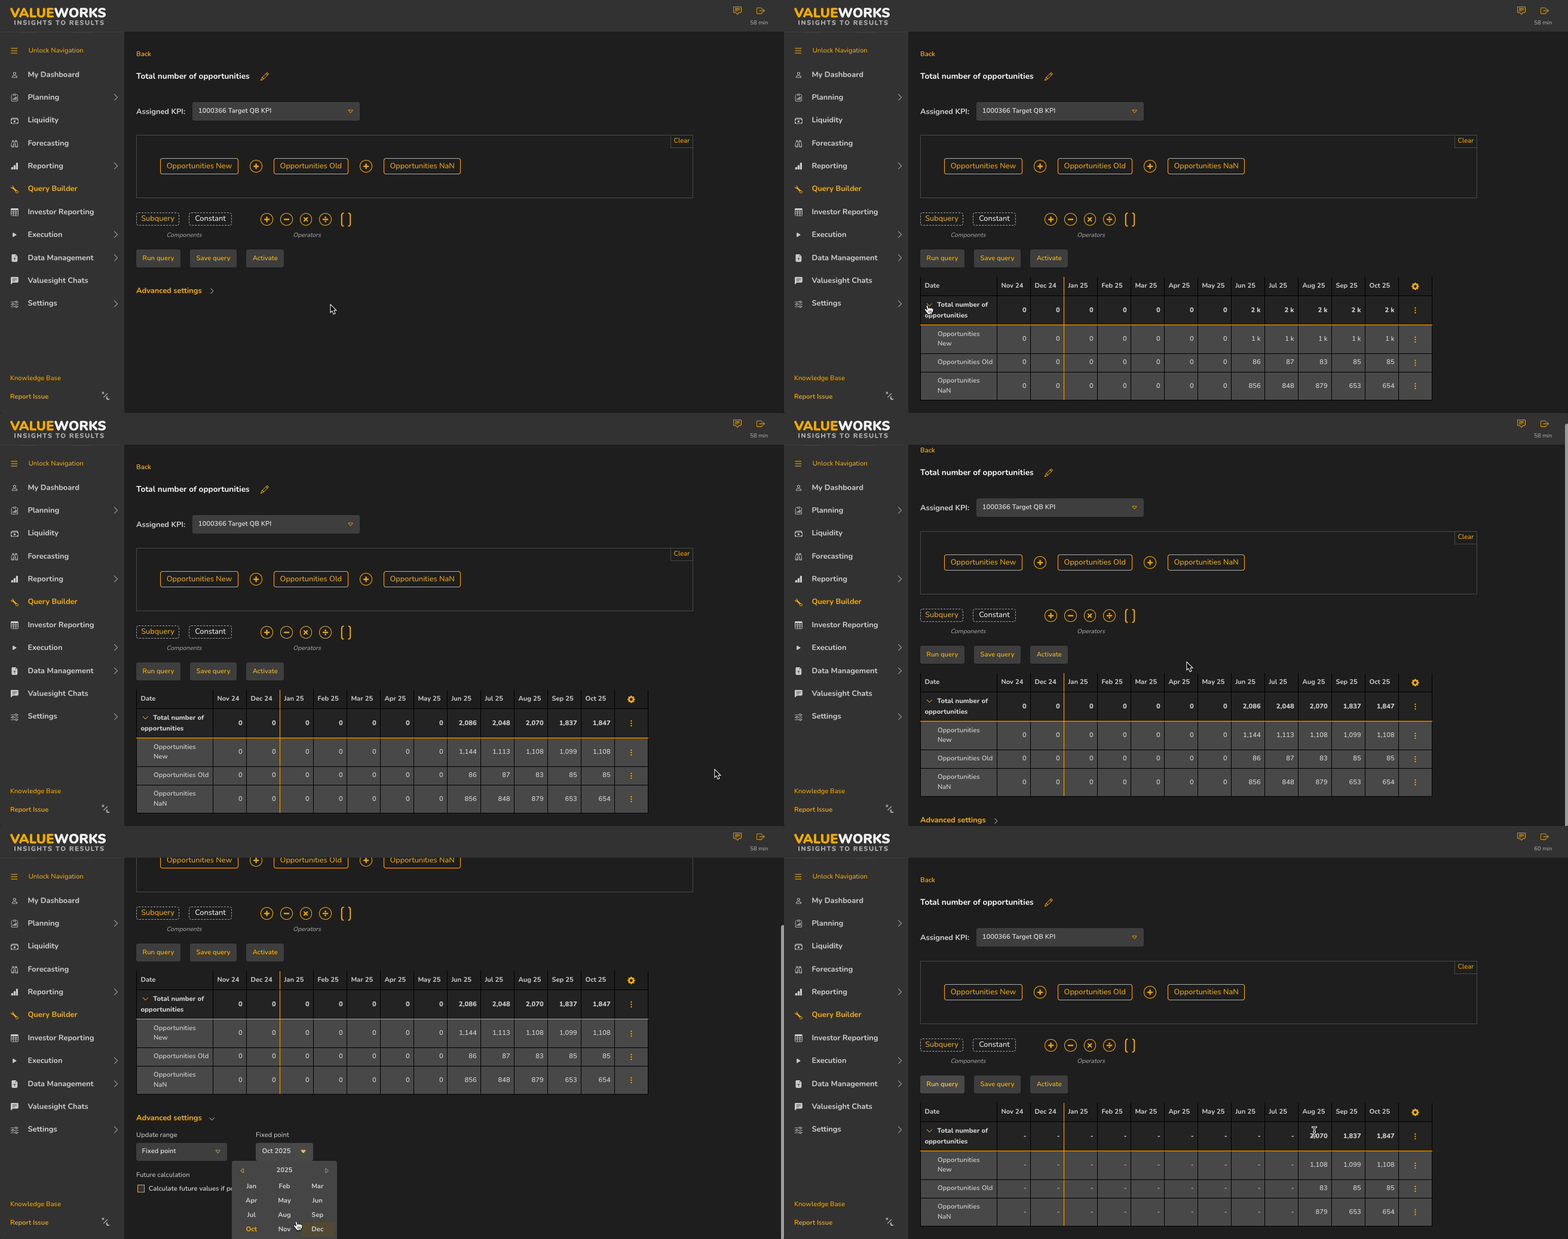

Simple definition of a new key figure along description dimensions
Formula input via intuitive editor in no-code approach
New key figure available everywhere, also for the OKR process
Charts (Chart builder)
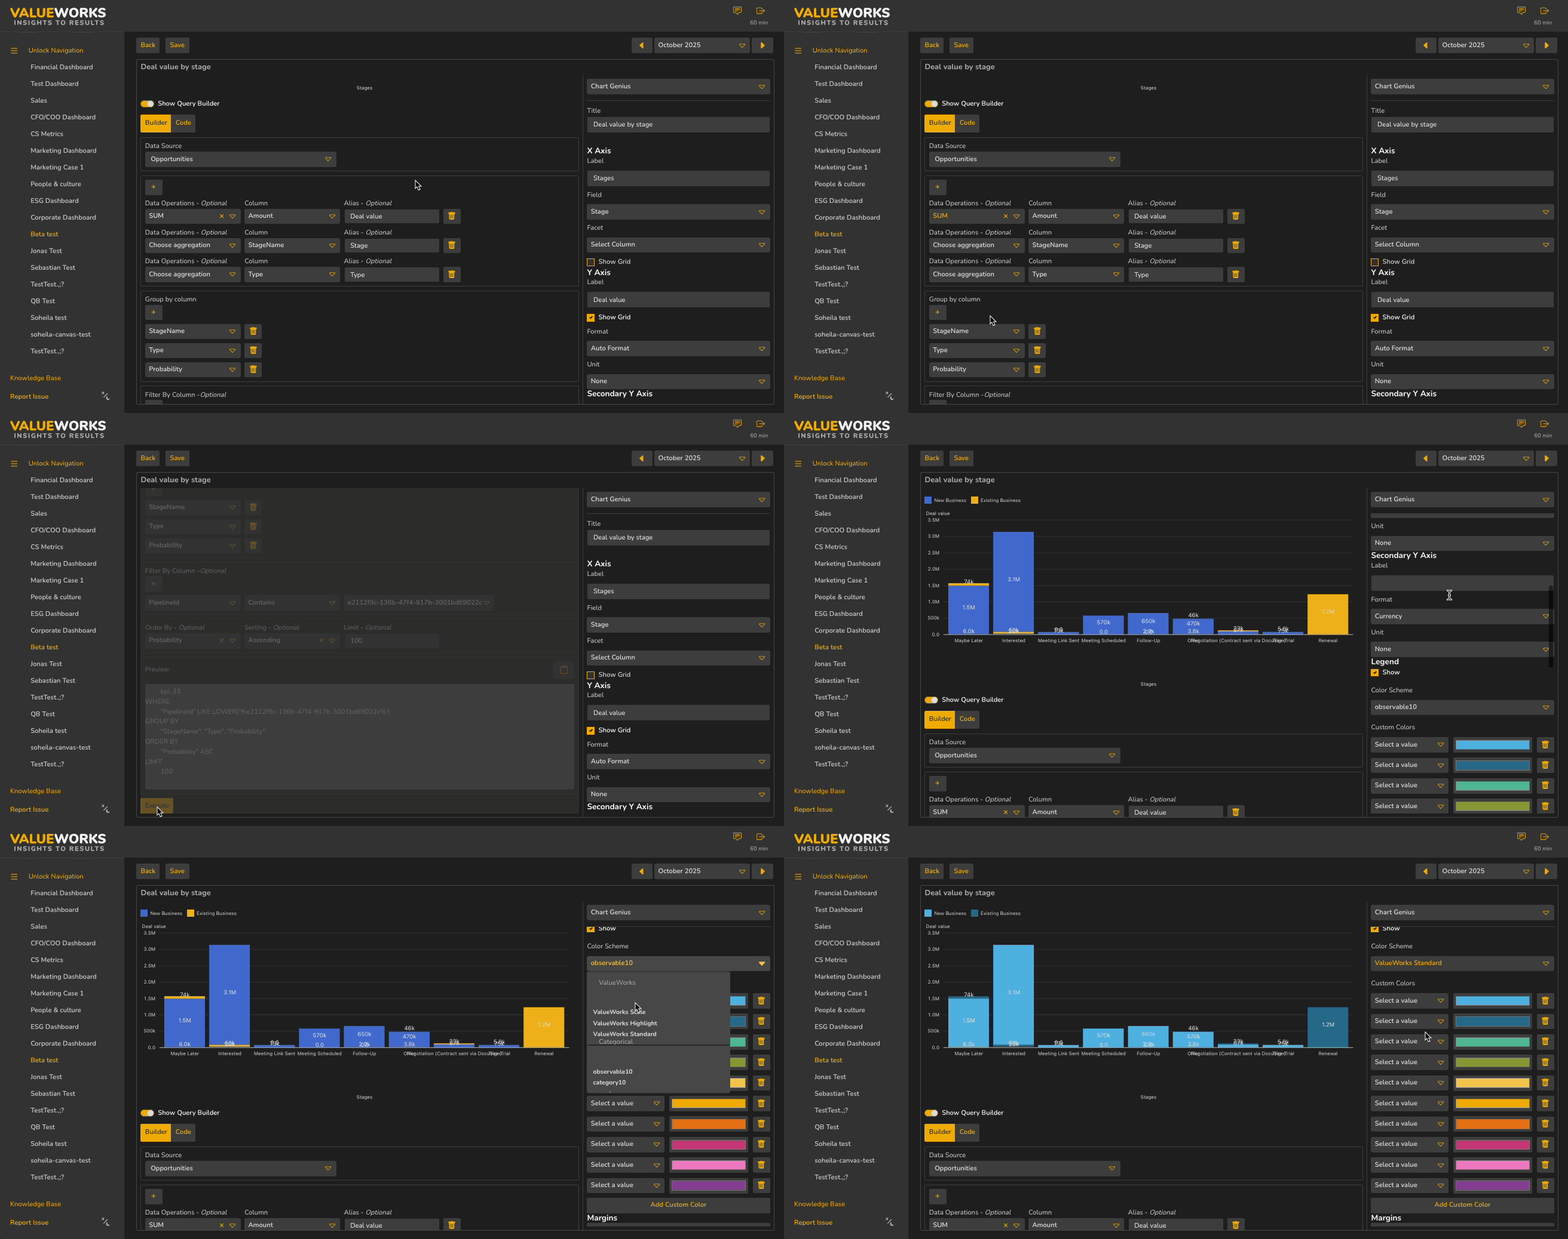
Basis is the list view for each key figure (e.g. individual bookings, customer list)
Selection from various graphic types (e.g. stack bar, pivot tables), data fields and formulas
Flexible naming of the generated graphics
Dynamic dashboards
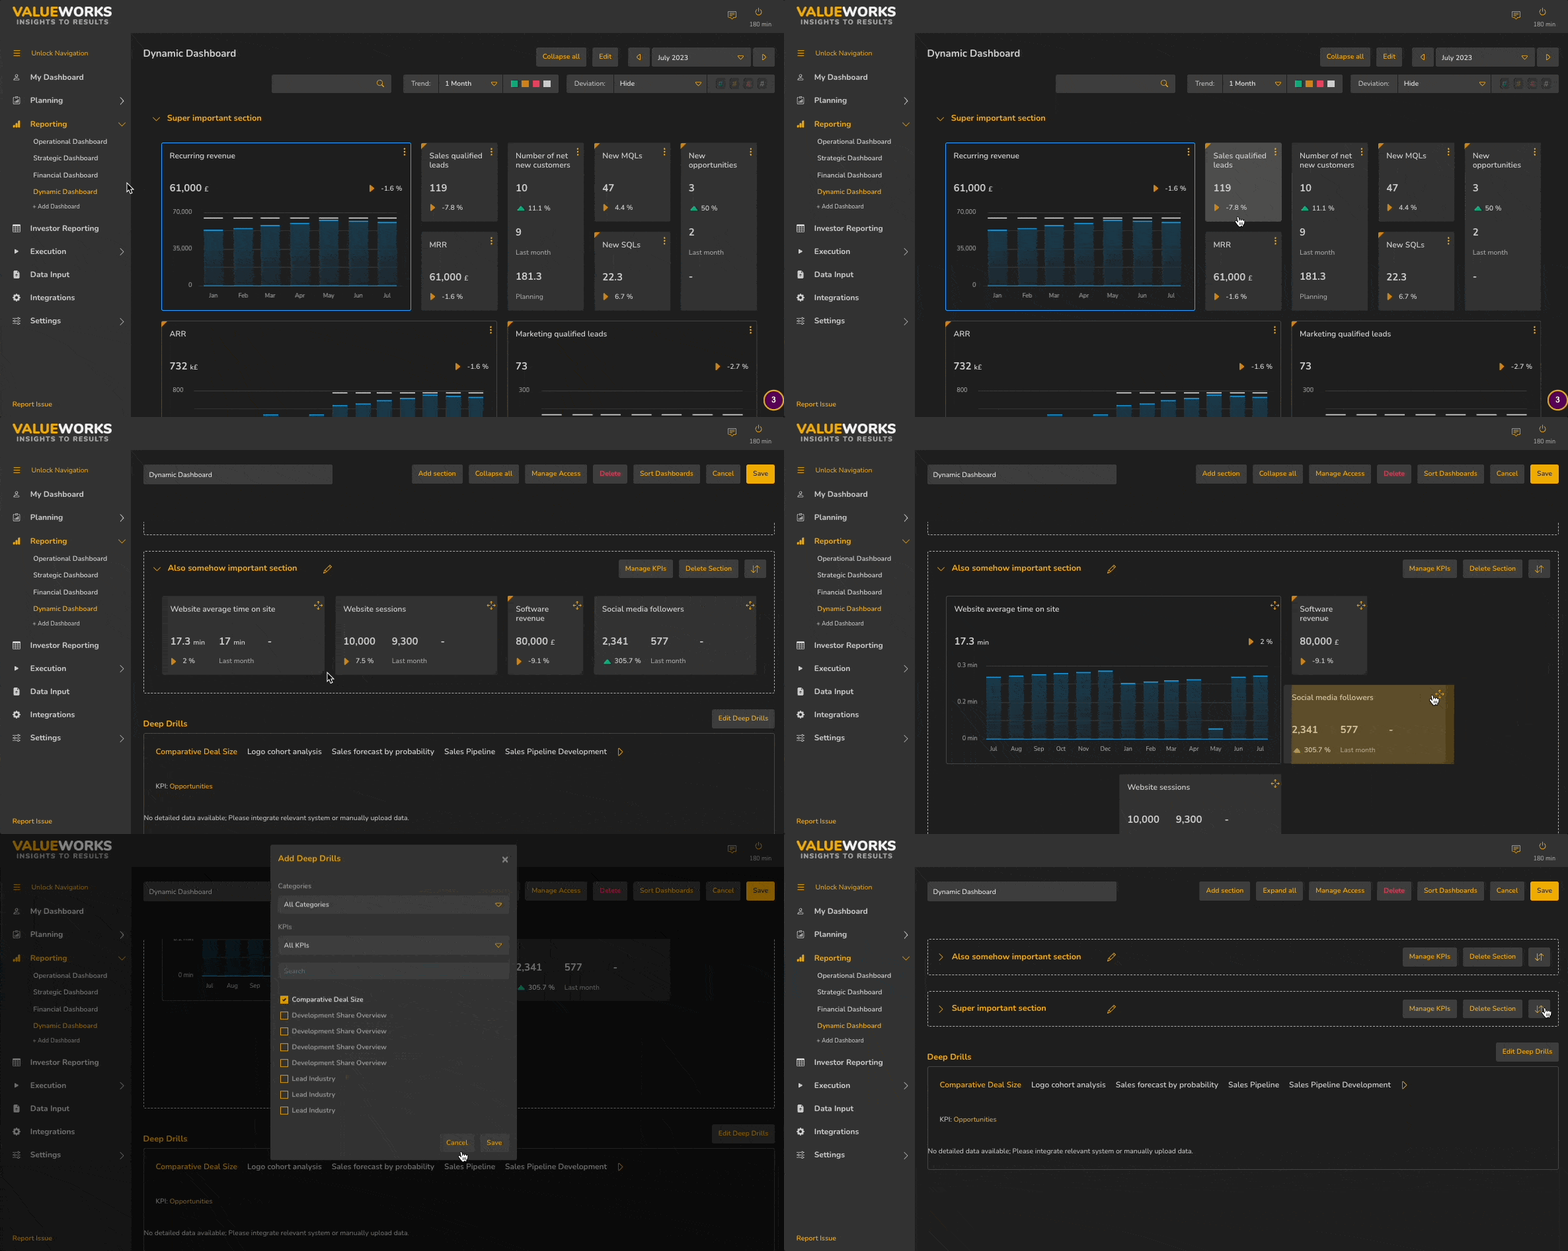
Drag & drop creation of new dashboards
Flexible size and shape of the key figure display
Release for special users possible (e.g. marketing dashboard)
Query Builder
Custom KPIs, built by the business.
A no-code editor for KPIs — define logic, debug subqueries, and control exactly what gets calculated.

Results per subquery for instant validation and debugging.
Precise time control — recalculate all months, from a fixed start, or
a rolling window.
a rolling window.
Multi-value filters via semicolon — one filter, many values.
Built with customers — every release shaped by real use cases.
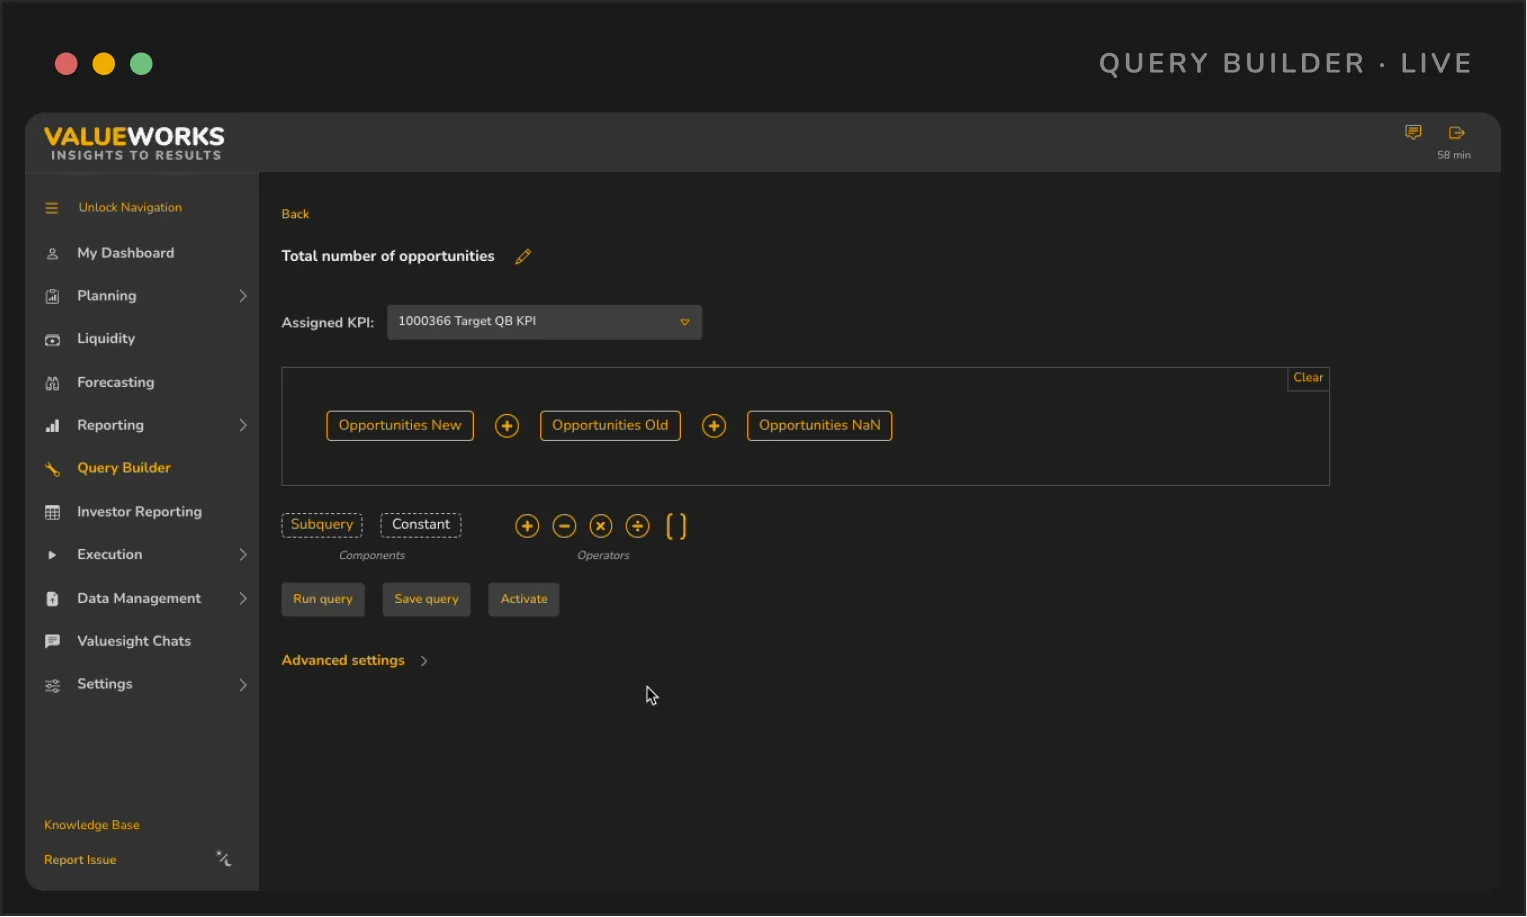
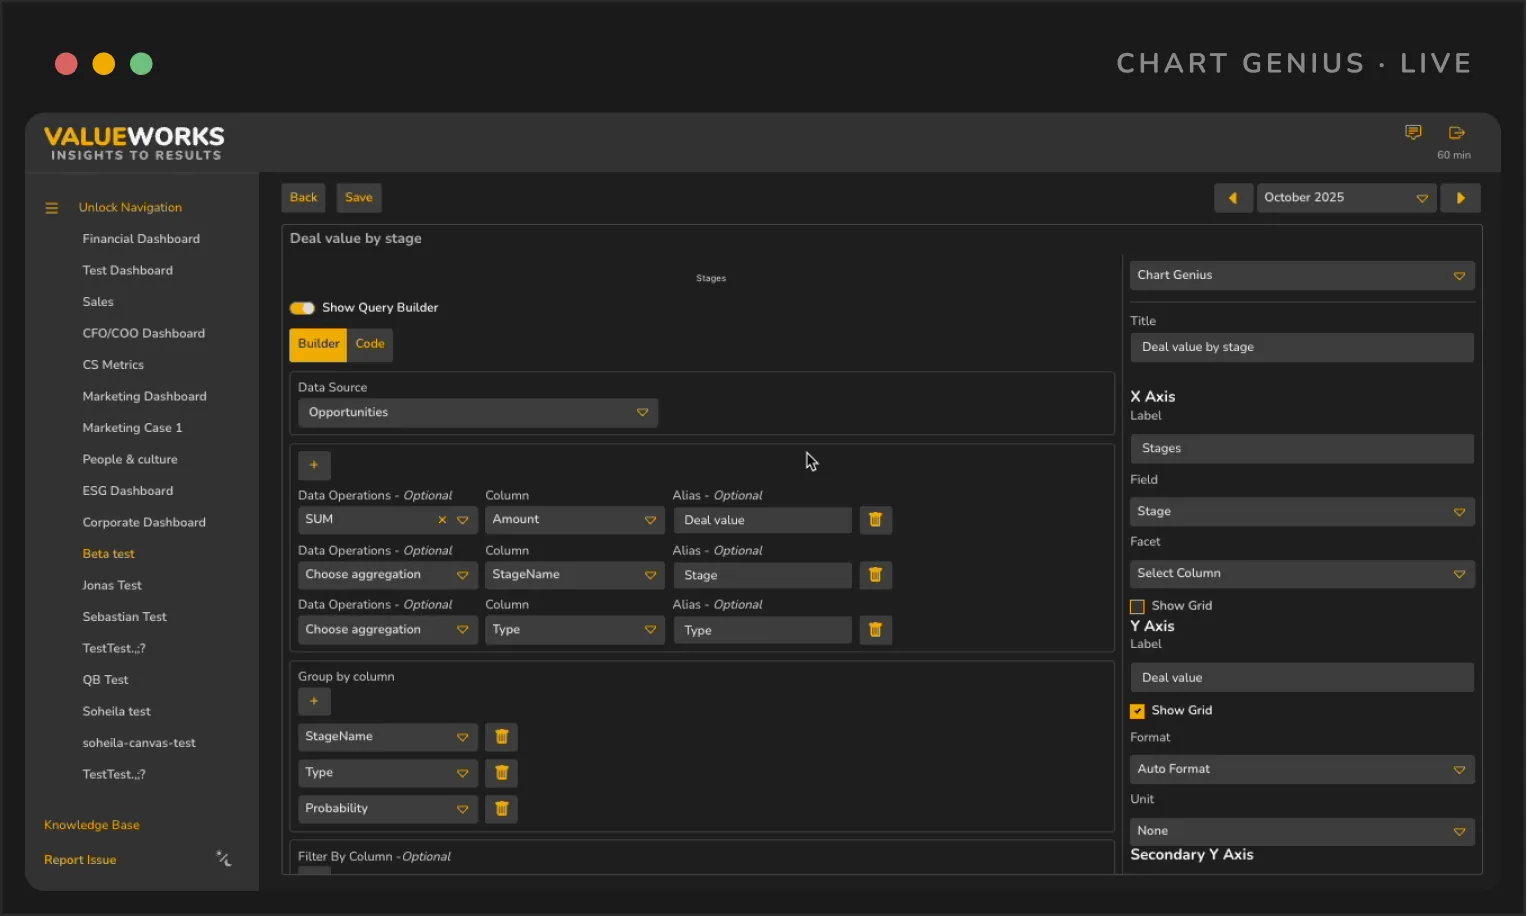
Chart Genius
Any chart. Your data, your look.
Go beyond monthly KPIs — visualize list views, combine sources,
or drop into SQL. Every chart, your way.
or drop into SQL. Every chart, your way.
List views as a data source — visualize the detail, not just the totals.
Multi-source charts — combine list views in one visualization.
SQL drop-down — drop into code when you need full control.
Date-picker independent — charts that just work.
Dynamic Dashboards
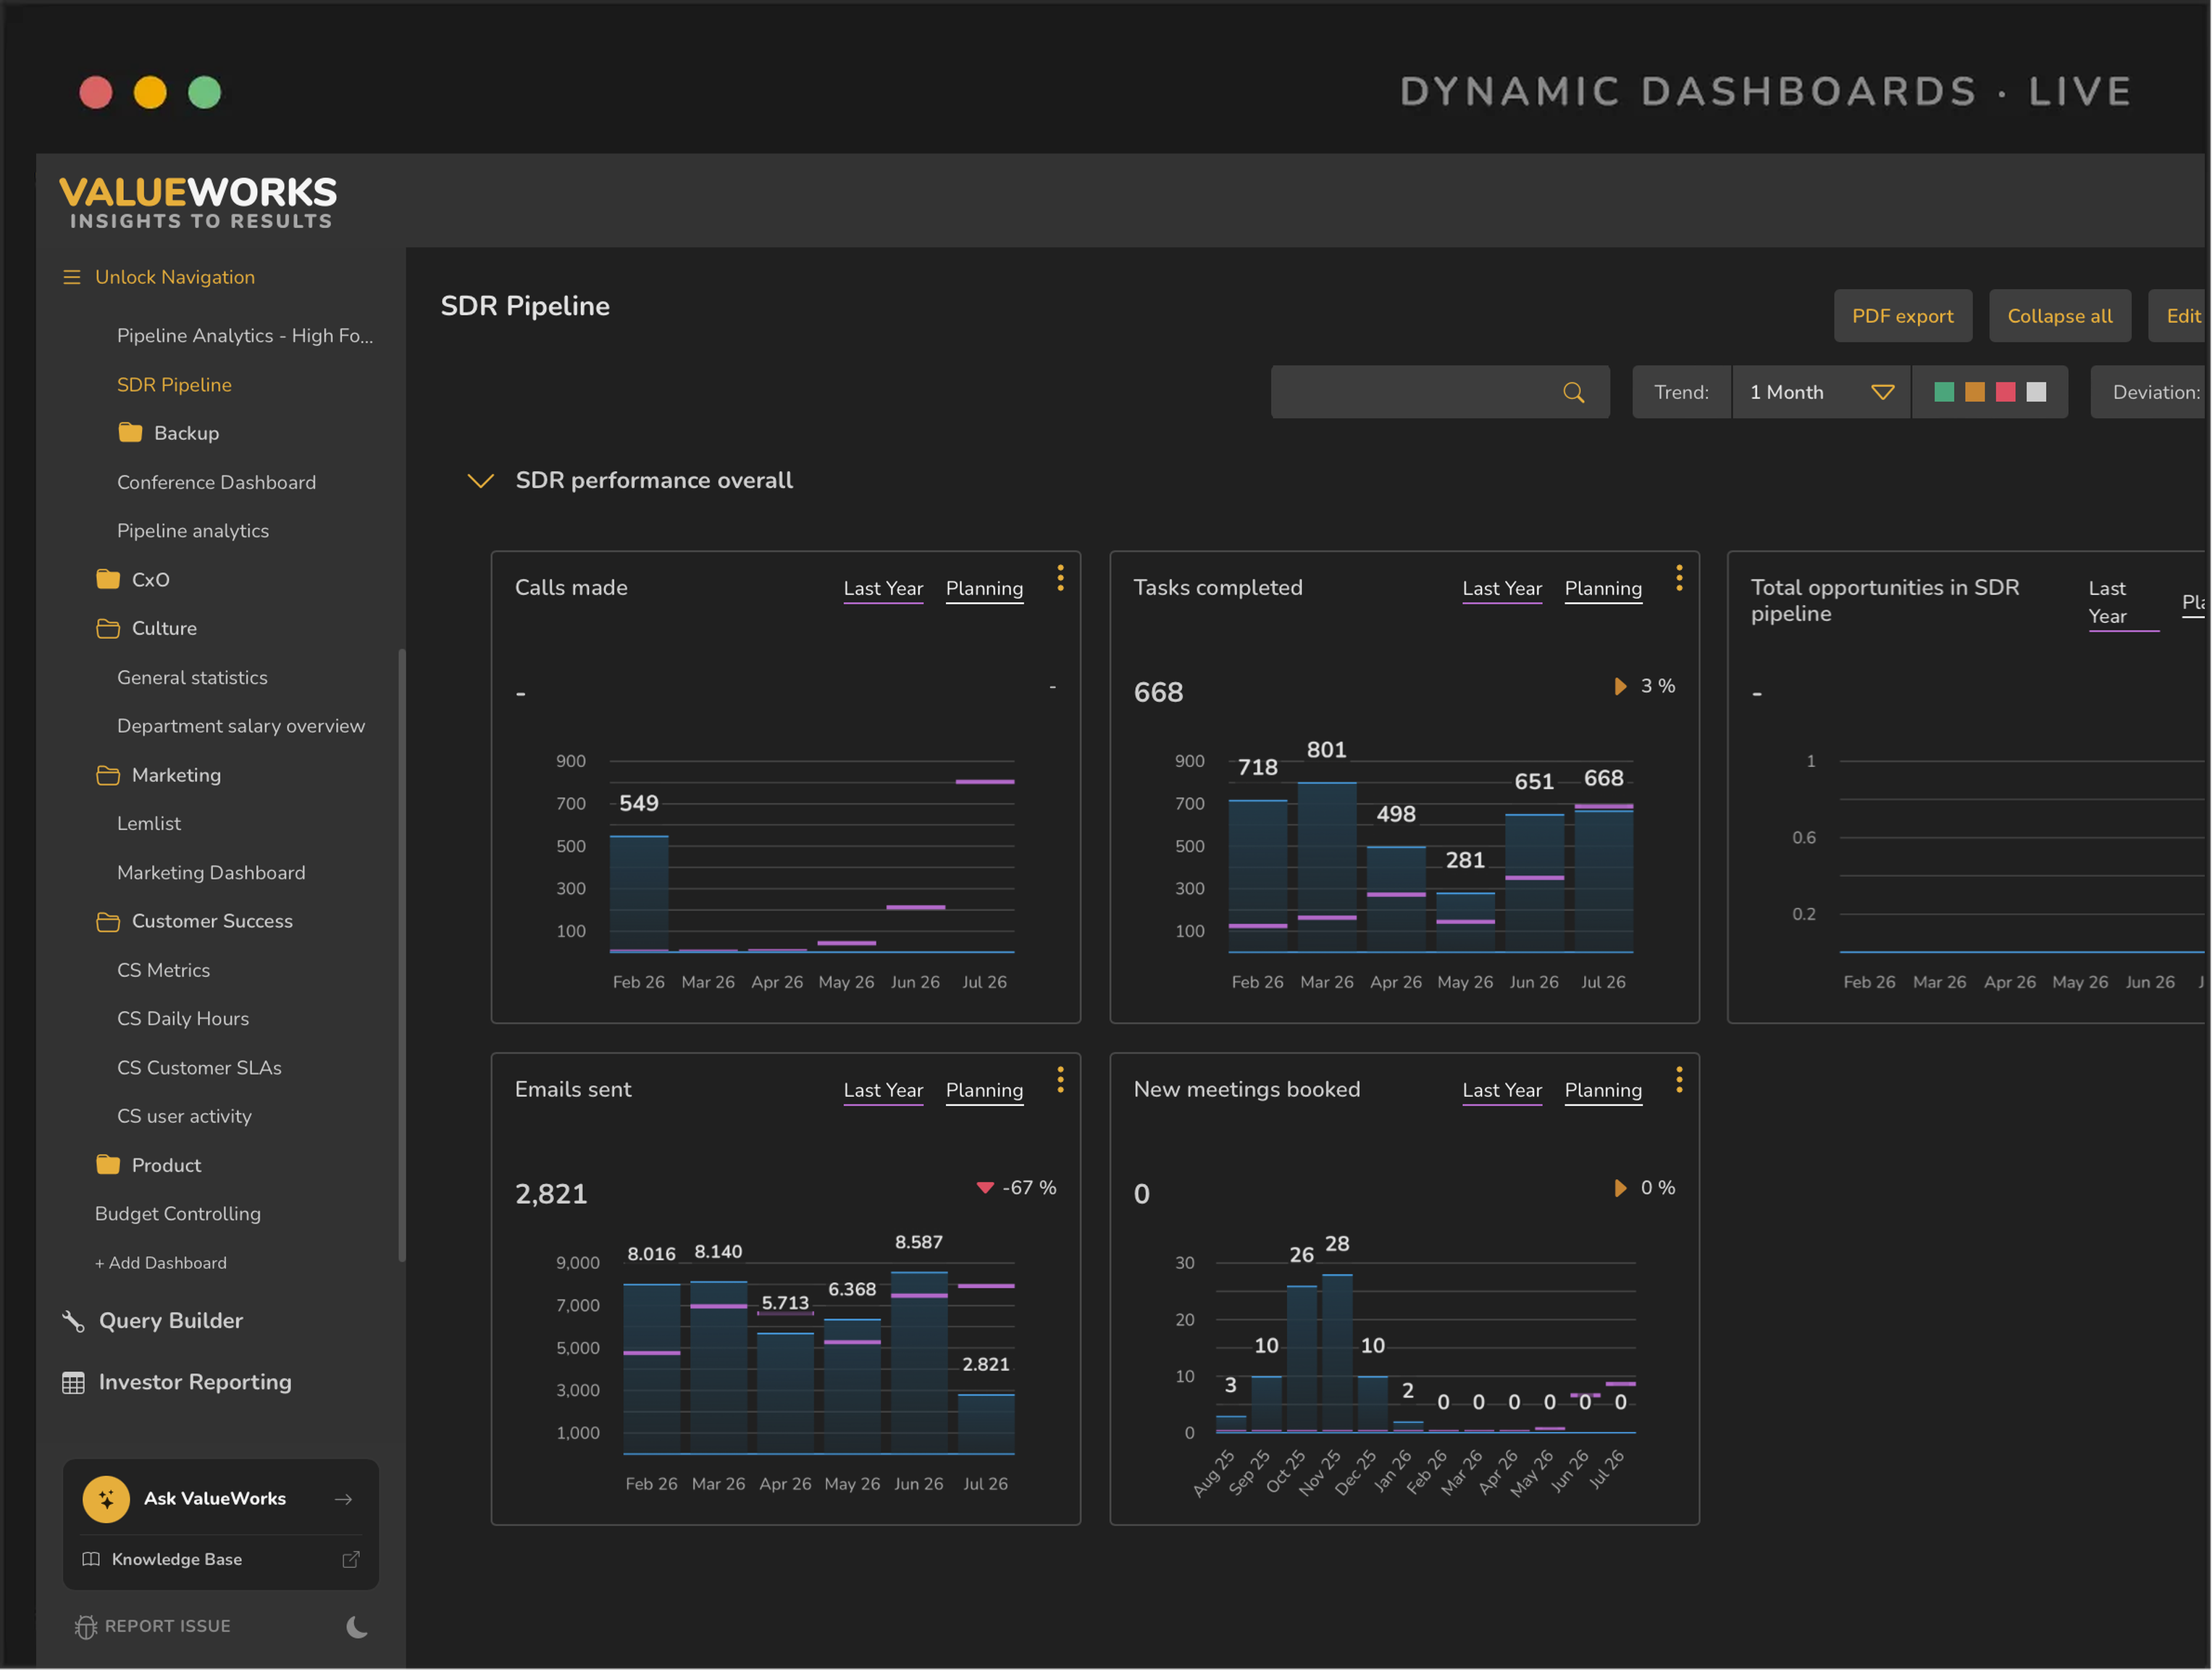
Live dashboards. Built by your team.
Drag and drop tiles to build dashboards. Size and arrange them
to fit how the team actually works.
to fit how the team actually works.
Drag-and-drop creation of new dashboards.
Flexible size and shape per KPI tile.
Release dashboards to specific user groups (e.g. marketing dashboard for the CMO).
Every tile tied to live data — no stale snapshots.
Built for everyone
Self-service for business and technical users.
Start no-code. Drop into SQL when you need to. Same data, same governance.
For the business user
No-code, no waiting
Build the KPI you need today — without filing a ticket with IT.

Drag-and-drop query components
Industry KPI templates as a starting point
Visualize instantly with Chart Genius
For the power user
SQL when you need it
Full SQL access for custom logic — on the same governed data layer.
SQL-based chart generation
Subquery debugging & validation
Combine multiple list views in one chart
95%
less reporting effort
100+
companies trust ValueWorks
NPS 85
customer satisfaction