

Decisions in 2 minutes
- not 2 days.
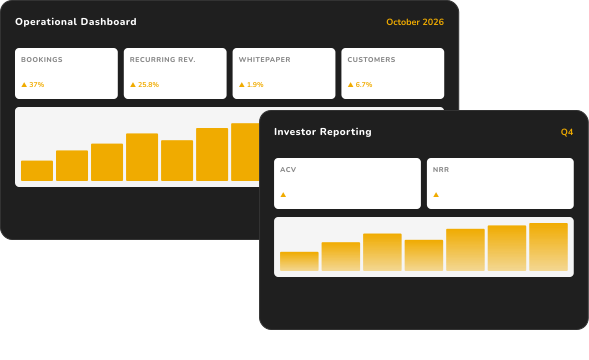
Investor reporting, executive dashboards, sales analytics, financial controlling. One live system. No more cryptic spreadsheets, no more 5-day month-ends.






"The biggest advantage is the consolidation of the different systems, having everything in this all-in-one solution, on one platform. (…) It also enables a very simple and straightforward reporting to our investors."

One canvas. One truth.
Reporting & Benchmarking
We provide you transparency on all levels of your business to be always fully informed and avoid unpleasant surprises that put your business at risk:




Investor Reporting
Most modern way of investor communications and alignment
Group Management
Centralised control and transparency across multiple entities in your group
Sales Excellence / RevOps
Manage growth with management view on the sales funnel:


Empower your decision-making with data-driven insights
Ensure transparency on all levels of your business to be always fully informed and avoid unpleasant surprises that put your business at risk.
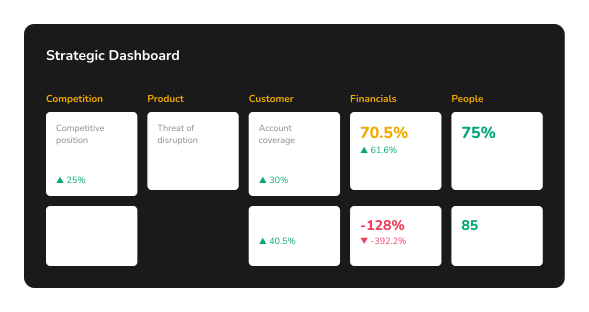
Strategic dashboard
Strategic dashboard is derived from your strategic goals and covers the key KPIs of your business plan.
Operational dashboard
Strategic dashboard is derived from your strategic goals and covers the key KPIs of your business plan.
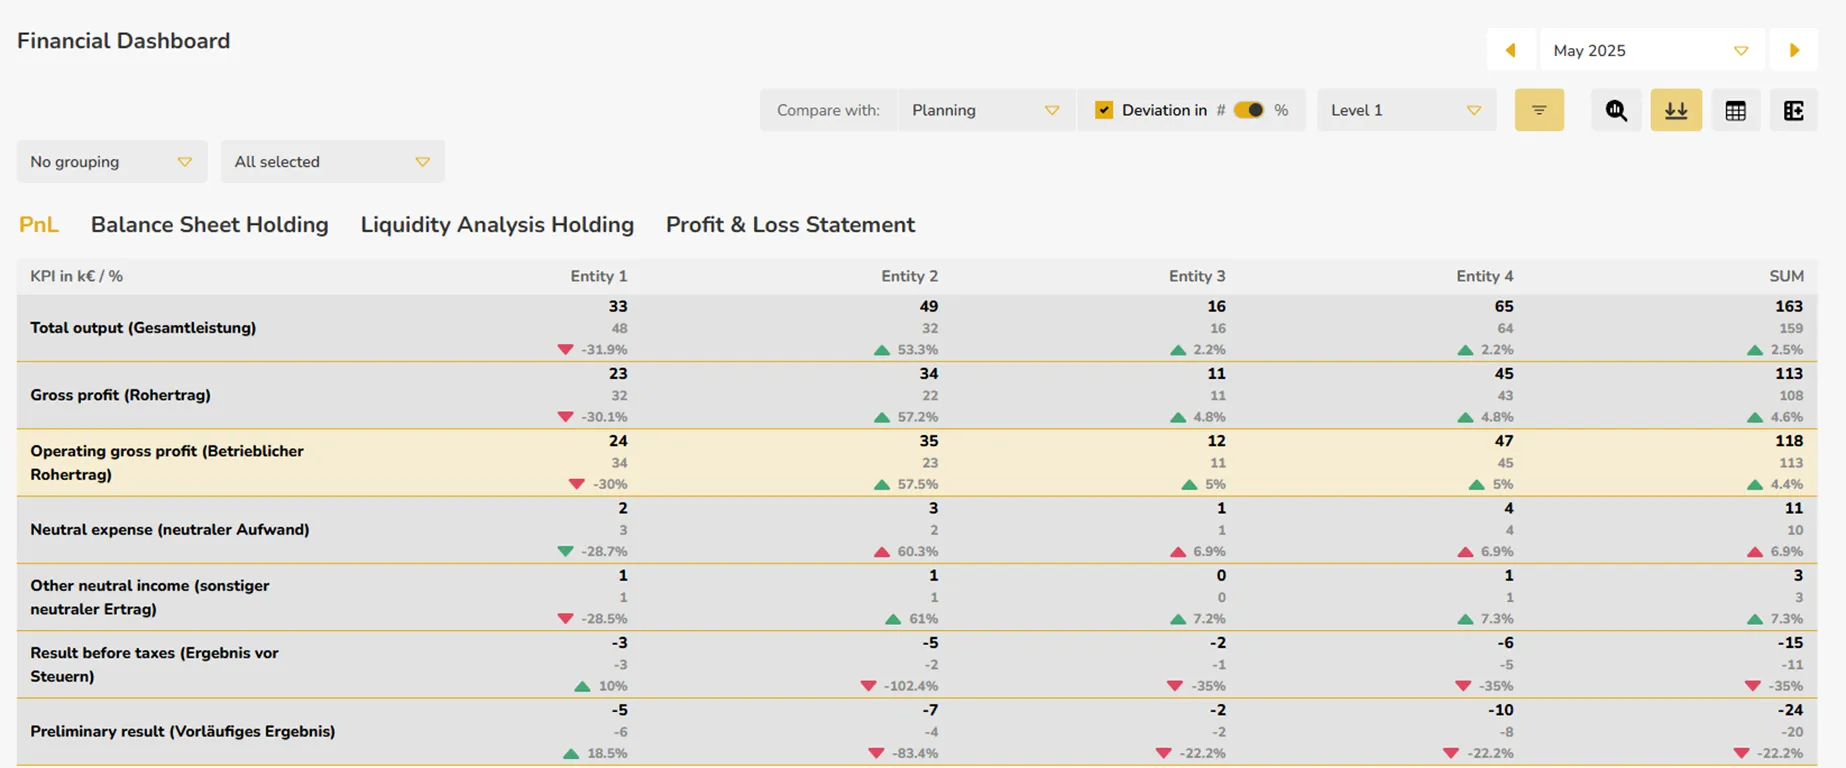
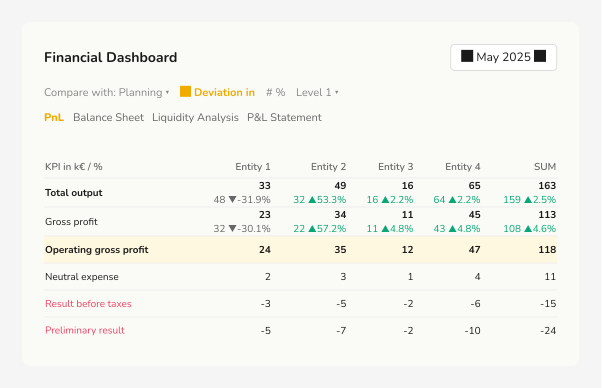
Financial dashboard
Following international reporting standards (Profit & loss statements in ‘Cost of sale’ methodology, liquidity planning, KPI tree).
ESG dashboard
ESG dashboard covers your compliance to the Environmental, Social and Corporate Governance standards with already incorporated benchmark values.
Custom & dynamic dashboards
Create customisable and flexible dashboards for LOBs, specific product areas or your OKRs. Add sections to structure your data and select from a wide range of existing KPIs. If needed, you can also define new KPIs. The visualisation of all KPIs is also dynamic — choose a bar chart to highlight trends or a single tile to maintain focus on a monthly value.
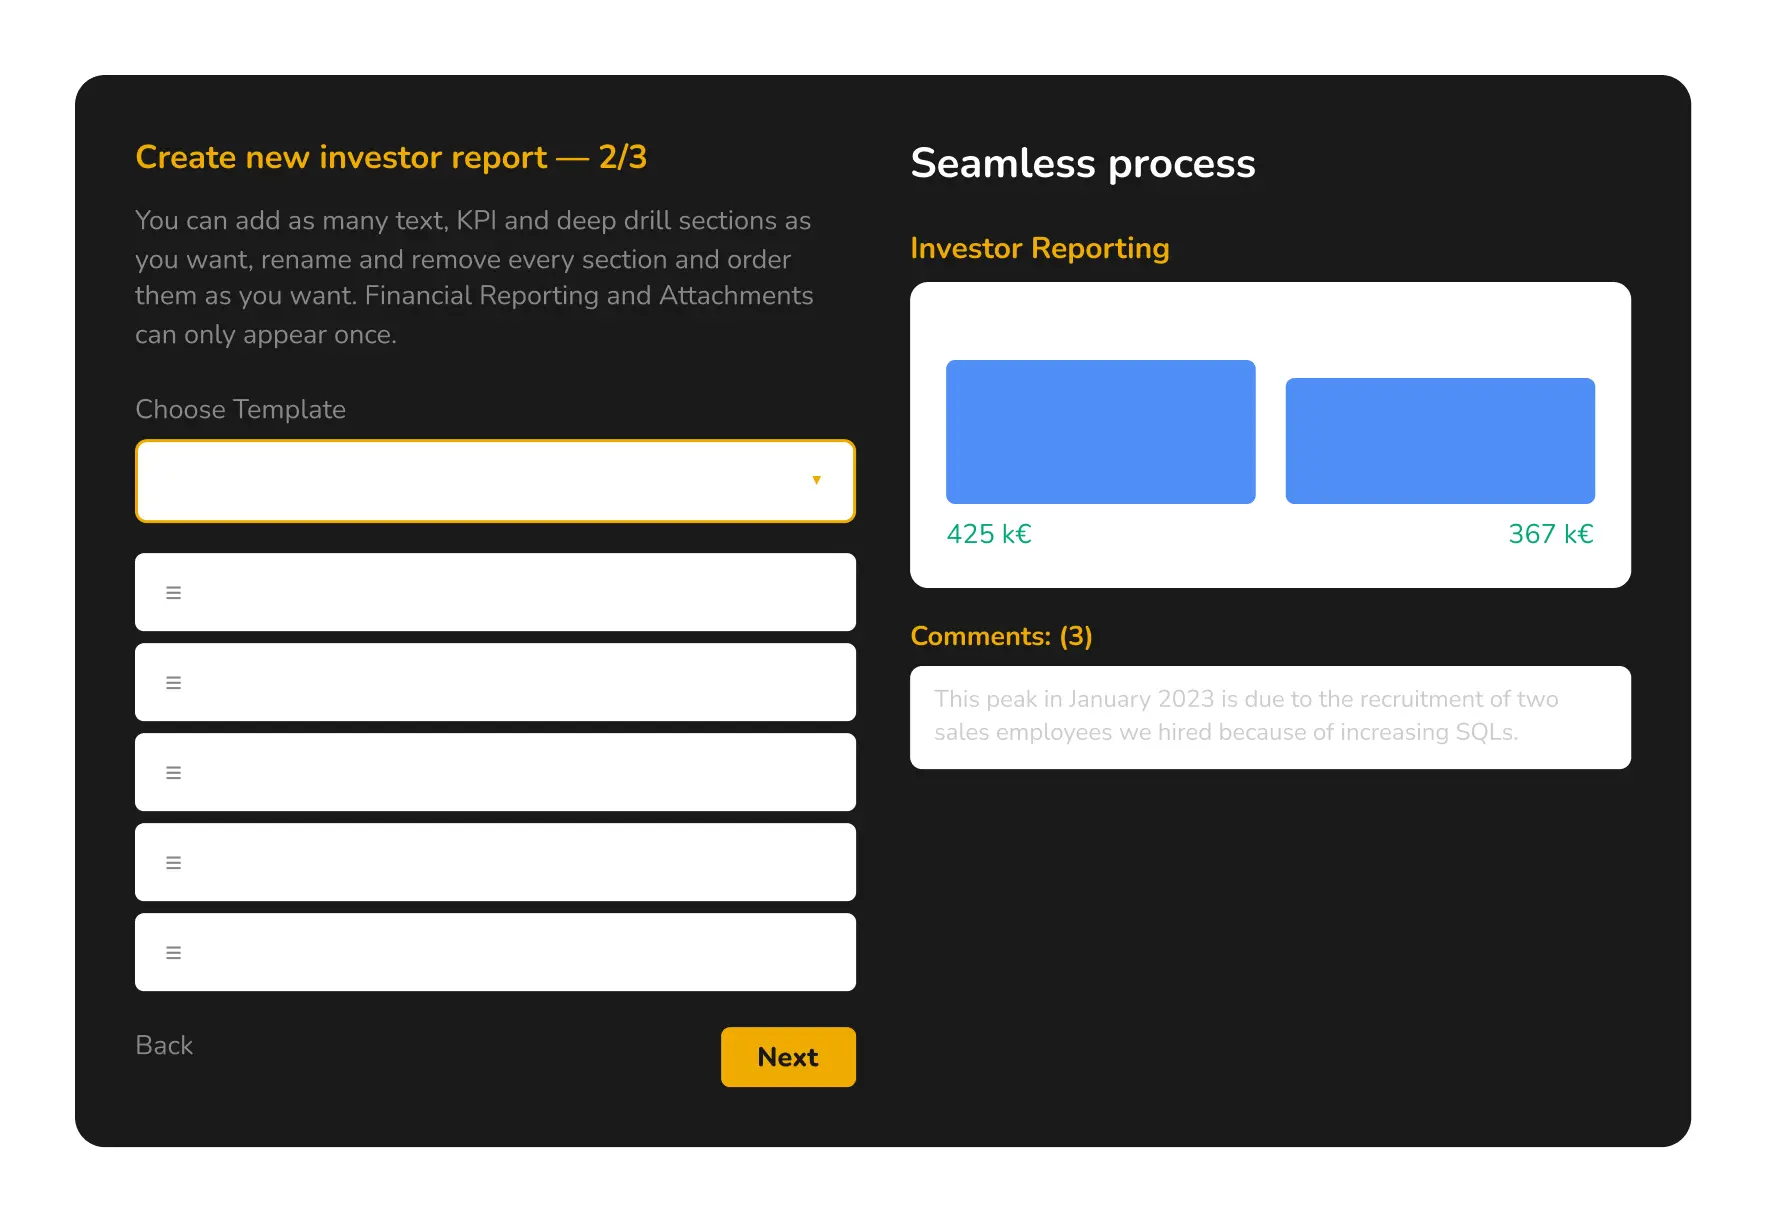
Experience cutting-edge investor communications and alignment
Create your investor update in 15 minutes leveraging integrations to the source systems and automated KPI calculation.
Seamless process & intuitive workflow
We provide an intuitive user flow & superior design experience that makes creating an investor reporting easy and simple, by completely automating the process in ValueWorks.
Create individual investor reporting templates
Choose from a KPI library with 100+ industry standard KPIs, define the list of recipients and add additional context in the form of e.g., an executive summary, an outlook or links to additional documents.
Collaborate with investors through comments
Enabling collaboration and exchange between company & investors. Your investors become ValueWorks users and have one professional go-to-place for your investor updates.
Freeze your data to create a periodical Investor reporting
After quality check and approval, you can freeze your data to get a snapshot for your Investor reporting, so that the numbers are no longer updated and quality assurance of the numbers is ensured.
Perform investor readiness check vs. benchmarks
Perform investor readiness check vs. benchmarks to identify areas of strength and weaknesses.
Intelligent, self-service group reporting for leadership
Accelerate your growth: master the art of sales excellence
Get management ready insights into your sales funnel in real time through out-of-the-box charts in the style of the top management consultants.
Out-of-the-box top management charts based on sales funnel visualizations
Identify the most important deals in your sales funnel to mobilize all functions for deal closure.
Conversion- & slipped deal analysis
Perform a correct conversion calculation by comparing today’s snapshot with the past (in contrast to a CRM system, which always shows the most current values).
Sales cycle analysis
Understand the duration of each phase in the sales cycle for different customer segments and products in order to reduce the cycle.
Cohort analysis
Identify patterns in customer behavior with the cohort analysis regarding churn, upselling over time, etc.
Sales forecast
Perform sales forecasting by determining future revenue on a monthly level by probability based on existing and new contracts.
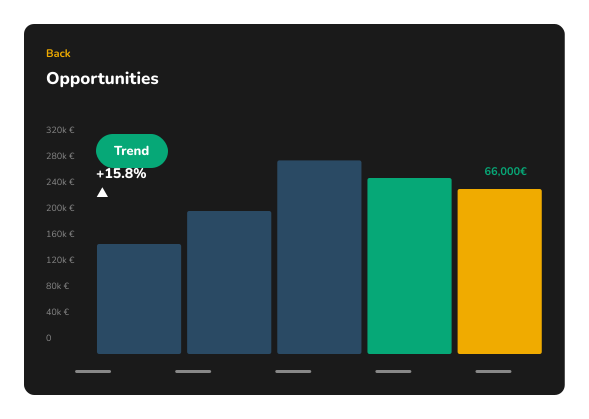
Nine views. One funnel.
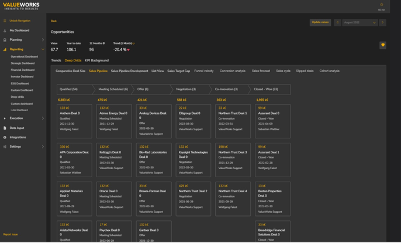
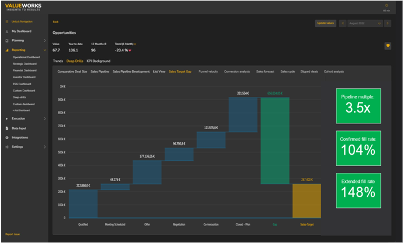
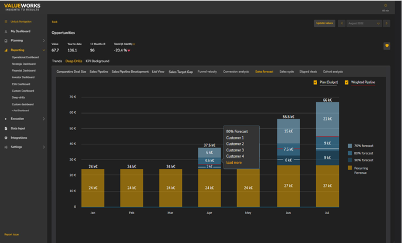
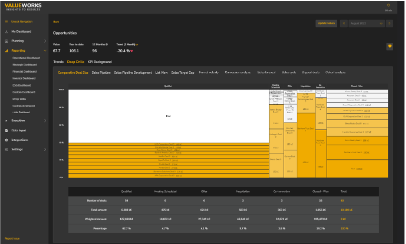
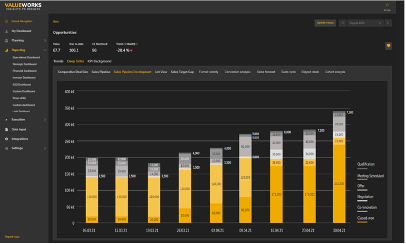
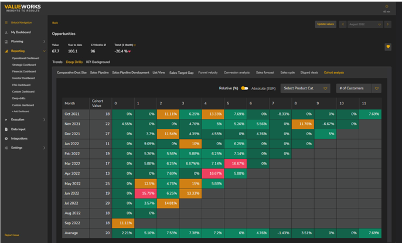
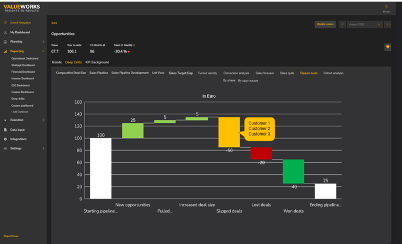
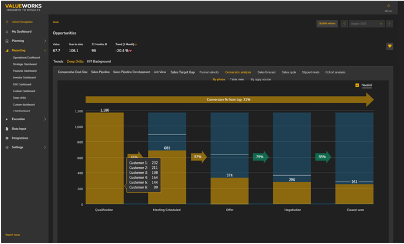
Management-ready sales reports out-of-the-box you can not get from your CRM
Why you need ValueWorks as an add-on to your CRM system to perform crucial management analysis

Whitepaper: OKR 2.0 — Mobilize your organization for growth
The benefits & implementation of the next-generation OKR method and the supporting software solution.


Why teams switch to ValueWorks.




From their mouths.


By using ValueWorks instead of a very extensive PowerPoint-based reporting system, we were able to increase the productivity potential of a portfolio company in the commercial area.

Managing Partner at Navigator Group