Finance · For CFOs & FP&A Teams

From actuals to forecast to board pack — one connected workflow.

Connect your finance and operational data, explain what changed, update your forecast and prepare management reporting in one place. Spend less time assembling numbers and more time supporting decisions.

2 min
Full close summary, not 2 days
95%
Less manual reporting effort
4–8 wks
Go-live, not 18 months
NPS 85
From 100+ companies
Built for finance teams

Less preparation. More analysis.

Three familiar obstacles between your team and a useful answer.

Actuals scattered across systems

Month-end starts with exports and reconciliations before your team can explain the numbers.

Board packs built by hand

The same figures are copied into spreadsheets and slides, leaving little time for the story behind performance.

Forecasts that need rebuilding

Changes in revenue, hiring and costs mean another round of spreadsheet updates and version checks.

Give your finance team more time to explain performance and guide the next decision.
See ValueWorks in action

Your FP&A workflow, connected.

Start with actuals, understand the drivers, update your forecast and draft a management summary.
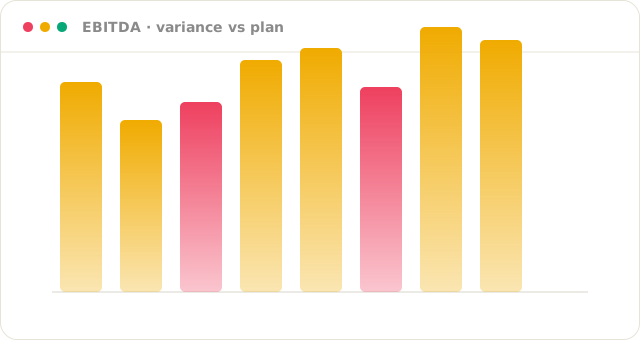
"Perform variance analysis with EBITDA 2025"

Variance surfaced in under 5 minutes.

The Close Agent runs automatically at month-end. ValueSight surfaces root causes, highlights deviations, and suggests corrective actions — ready to act on, not buried.
01-variance-analysis (1)
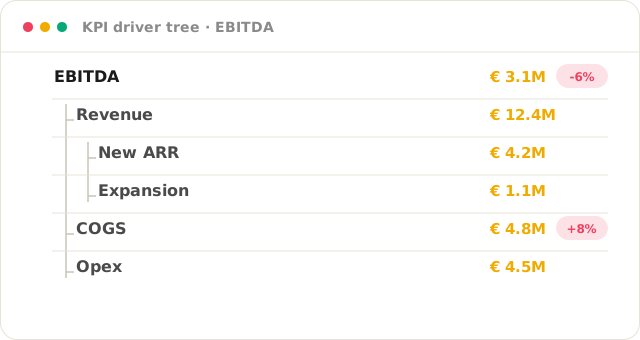
"Perform Root Cause Analysis"

From summary to root cause in one click.

KPI driver tree visualization — interactive, expandable, every node connected to live data. A unique ValueWorks visual asset that turns symptoms into actions.
02-root-cause-analysis
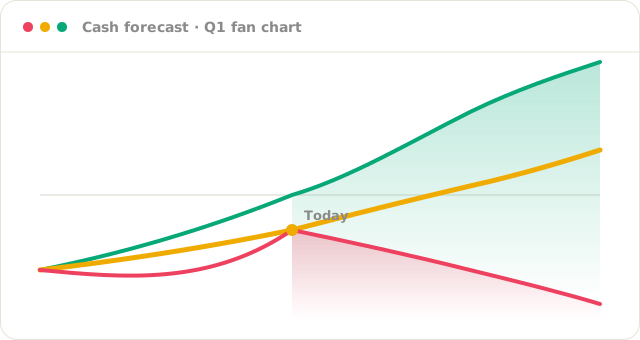
"Perform a forecast for Q1"

Scenario fan, probability ranges.

Auto-updated from live CRM, HRIS and bank data. Monte Carlo cash scenarios refresh as pipeline shifts — always the most current view.
03-monte-carlo-forecast (1)
"Create a board summary email for management"

Draft appears in seconds.

Draft a management summary with commentary on what changed, why it changed and what needs attention. Your team reviews the narrative before sharing it.
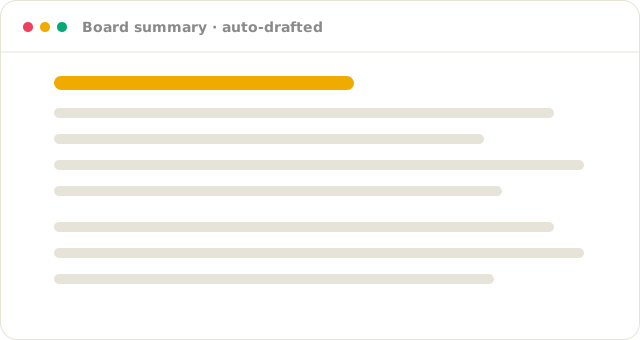
04-board-pack-generation (1)
Trusted by finance leaders

100+ companies trust ValueWorks with their most critical financial decisions.

85
NPS Score
from ValueWorks customers
ValueWorks helped us run our business faster, because data-driven decisions can now be derived more quickly and the relevant data is now available more quickly, more easily, and in a more understandable way for all managers.
Christopher Catterfeld · Group CMO, GSG
Customer case study: ASKUI reduced the time needed to produce its monthly investor report to 15 minutes.
ASKUI · Monthly investor reporting
Read the ASKUI case study →
Makerssite Logo
Hubject Logo
Verso Logo
Logo Hz
Logo people who kaer
Logo Lapmaster Wolters
Fiorucci Logo
Genii Logo
Navigator Group Logo
People Path Logo
Makerssite Logo
Hubject Logo
Verso Logo
Logo Hz
Logo people who kaer
Logo Lapmaster Wolters
Fiorucci Logo
Genii Logo
Navigator Group Logo
People Path Logo
The differentiator

Understand not just WHAT is happening — but WHY.
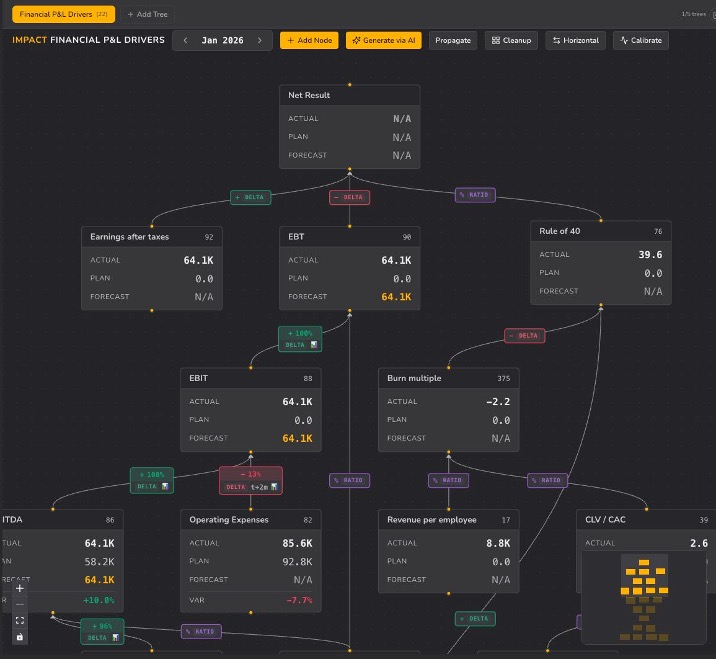
Instantly see which sub-driver is causing a KPI deviation.
Drill from board-level summary to root cause in one click.
Every node connected to live data — always current, never stale.
Follow the drivers behind a variance so your team can explain performance and decide what to do next.
How it works

One data foundation for your finance team.

Shared data and consistent definitions connect planning, analysis and reporting.
01
Connect
Bring your data together

Connect accounting, ERP, CRM, HR, billing and banking data through existing integrations.

02
Align
Work from consistent numbers

Use shared KPI definitions, business rules and access permissions across planning and reporting.

03
Act
Turn analysis into decisions

Explore variances, compare scenarios and prepare management summaries using your connected data.

Implementation in 4–8 weeks

A clear path from first call to go-live.

We agree the scope and timing together, based on your systems and workflows.
1
Week 1
Discovery & data mapping

Together, we identify your source systems, reporting priorities and planning requirements. Your team provides access and confirms the business definitions.

2
Weeks 2–4
Connect and validate your numbers

ValueWorks configures the data connections, KPIs and permissions. Your finance team checks the results against its existing reports.

3
Weeks 5–8
Go-live

Train your team and put the agreed reporting and forecasting workflows into use, with implementation support from ValueWorks.

No internal IT team required
No additional headcount needed
Guaranteed project success
Microsoft Azure · GDPR · SSO

See your finance workflow in ValueWorks.

Explore actuals, variance analysis, forecasting and management reporting in a demo tailored to your finance team.